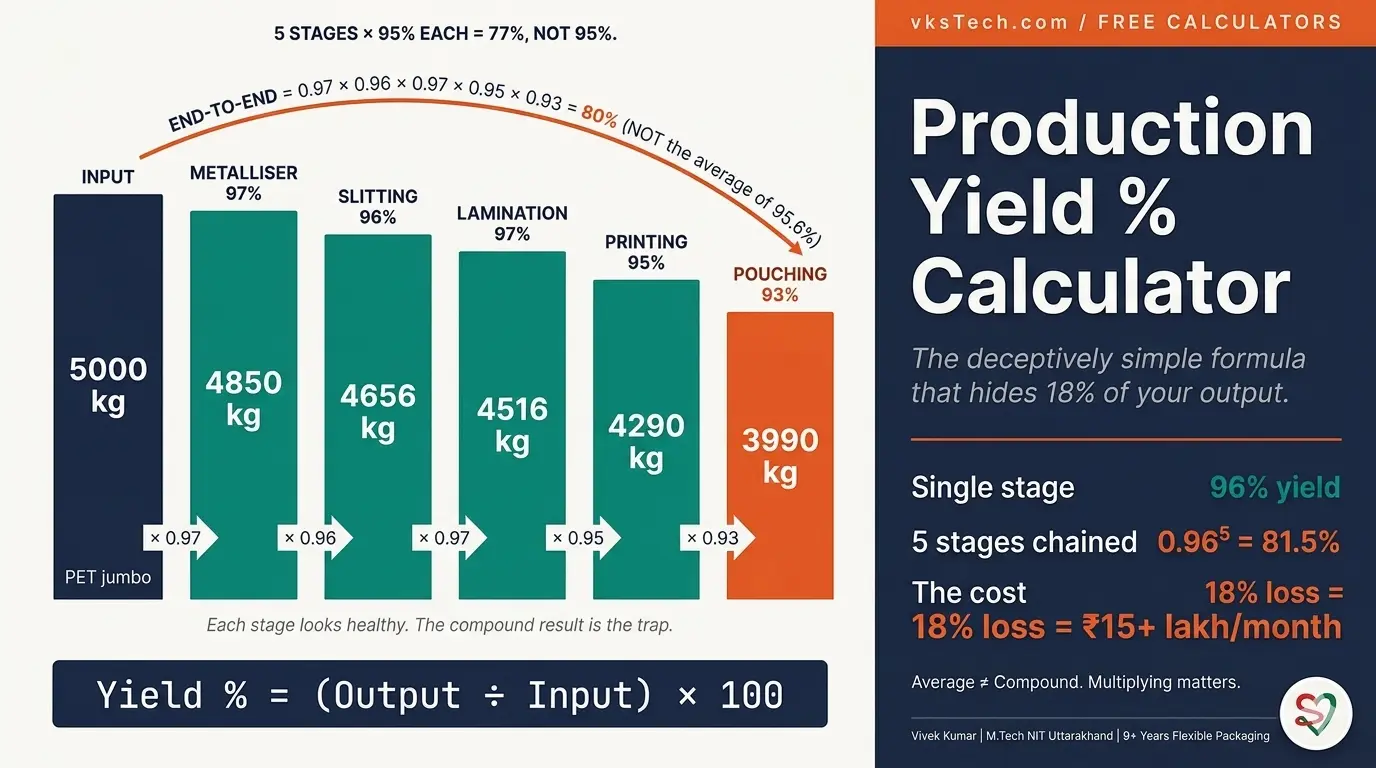
📊 Production Yield % Calculator — The Deceptively Simple Formula That Hides 18% of Your Output
📖 9-min read | The Single Number That Tells You What Came Out vs What Went In | Published May 2026
A 5,000 kg metalliser jumbo enters the slitter. The slitter outputs 4,830 kg of customer-ready rolls. Yield is 96.6%. Easy. But that same jumbo's journey continues — 4,830 kg goes to lamination (output 4,720 kg, yield 97.7%), then to printing (output 4,490 kg, yield 95.1%), then to pouching (output 4,150 kg, yield 92.4%). The end-to-end yield is not the sum of the four stages or the average — it is the product: 96.6% × 97.7% × 95.1% × 92.4% = 83.0%. The customer pays for 5,000 kg of jumbo input but receives 4,150 kg of finished pouches. 17% of every kilogram bought becomes scrap, edge trim, or process waste somewhere along the chain. This blog explains the formula behind the free Production Yield % calculator on vkstech.com — what it computes, the seven real situations operators and supervisors use it for, and why the simplest formula in flex-pack production is also the most often misapplied.
📐 Why "Just Divide Output by Input" is Harder Than It Sounds
The formula has three pieces, each with a definitional choice that changes the answer. Input: do you count the gross weight loaded onto the machine, or do you count after first-roll setup waste? Output: does "good" mean shipped to customer, or accepted by QC, or just produced (regardless of whether it was rejected later)? Boundary: where does the process start and end? A "metalliser yield" can mean only the metalliser cycle, or it can mean the metalliser-plus-pre-slit waste, or the metalliser cycle plus all tail-end downgrades caught in slitting.
None of these choices is wrong. But two plants comparing yield numbers have to use the same definitions, otherwise the comparison is meaningless. Most plants pick one definition and stick with it for trend analysis — improvement over time within a single plant is more valuable than absolute comparison across plants. The calculator below assumes the simplest definition: input is what enters the process, output is what is acceptable as it leaves the process, both in the same unit (typically kg).
The unit you pick matters too. Yield in kg tells you the mass-conversion efficiency. Yield in metres tells you the length-conversion efficiency (different from kg if there are micron-thickness changes between input and output). Yield in rolls tells you the count-conversion efficiency (useful for slitting if input rolls are split into multiple output rolls). Most plants standardise on kg because that is what production planning, costing, and inventory all run on.
🛠️ The Seven Real Situations Operators Use This For
1. Daily shift performance. The simplest use. End of every shift, the operator reports input weight (or length), output weight, and the formula gives yield. Trended over weeks, this is the single most-watched number in any flex-pack production review.
2. Boat-set life optimization. Within a metalliser cycle, yield is highest at the start (fresh boats, stable conditions) and degrades toward the end (boat consumption, vapor instability). Tracking yield by hour-of-cycle tells you when to schedule the next boat change. The yield curve is the cost-of-stretching-cycle data.
3. Substrate trial evaluation. A new film is being trialed. Standard run yields 96%. Trial run yields 91%. The 5-percentage-point gap is what the engineering team has to either solve (process tweaks) or build into the costing (acceptable trade-off for the new substrate's other benefits). The formula quantifies the gap.
4. Operator-vs-operator comparison. Same machine, same shift duration, same product spec, three operators across three shifts. Yields are 96.5%, 94.8%, 92.1%. The 4.4-point spread is operator-skill or operator-attention, not equipment. The number identifies the training gap.
5. End-of-month financial close. Procurement bought 100 tonnes of substrate. Production reported 92 tonnes of finished output. The 8% gap shows up in inventory reconciliation. If accounted for as yield loss, it goes to cost of goods sold. If unaccounted for, it sits as inventory variance and triggers an audit. The formula closes the books cleanly.
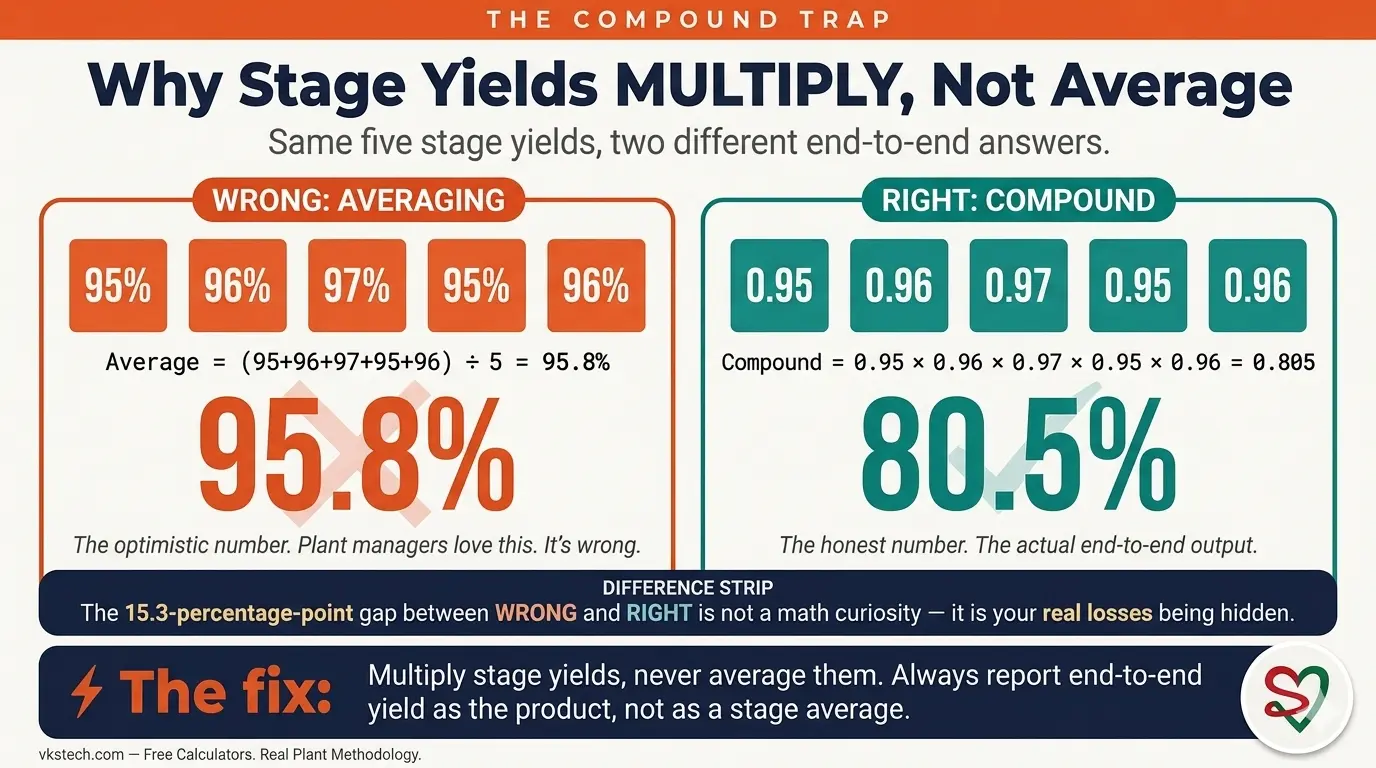
6. Compound yield analysis (multi-stage). For end-to-end yield, multiply each stage's yield together. Five stages at 95% each = 77.4%. Five stages at 97% each = 85.9%. Even small per-stage improvements compound dramatically. The formula identifies where the compound multiplier hurts most.
7. Sales-to-procurement reconciliation. Sales books 5,000 kg of customer order. Procurement buys 5,500 kg of substrate, expecting ~9% yield loss. If actual yield is 95% (loss 5%), production over-buys by 4 percentage points and inventory bloats. If actual yield is 85% (loss 15%), production under-buys and the order ships short. The formula sets the buffer.
🧮 Production Yield % Calculator (Embedded)
The calculator below calculates yield, loss percentage, and absolute loss quantity from your input and output values. Works in any consistent unit (kg, metres, sqm, rolls). For shareable links and other related tools, use the full version on vkstech.com.
📊 Quick-Look Reference — Typical Yield Benchmarks
The table below shows typical yield ranges for common flexible-packaging stages. "Good" means the top quartile of plants in India; "Average" is the median; "Poor" is the bottom quartile. Bookmark for benchmarking conversations.
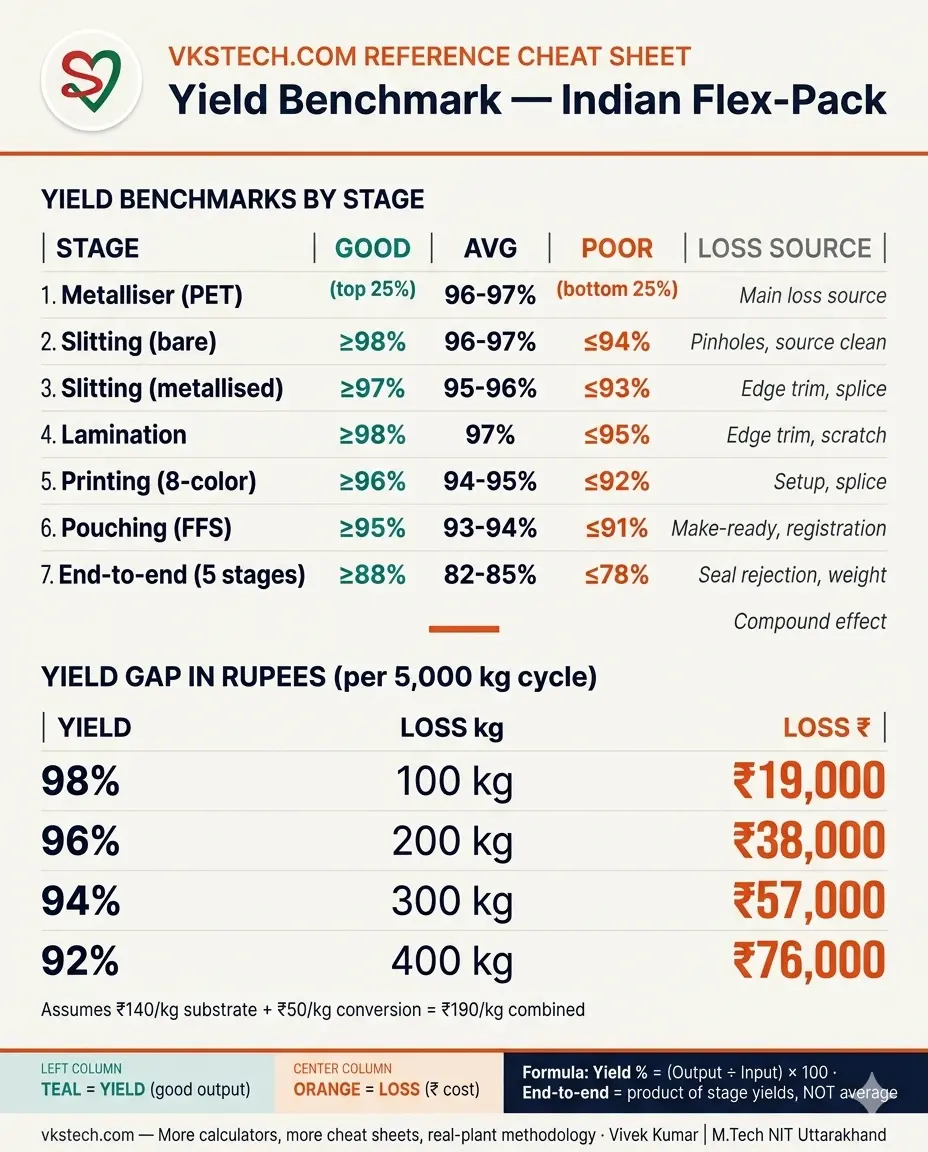
| Process stage | Good (top 25%) | Average | Poor (bottom 25%) | Main loss source |
|---|---|---|---|---|
| Metalliser (PET 12μm) | ≥ 98% | 96-97% | ≤ 95% | Pinholes, source cleaning waste |
| Slitting (bare) | ≥ 98% | 96-97% | ≤ 94% | Edge trim, splice waste |
| Slitting (metallised) | ≥ 97% | 95-96% | ≤ 93% | Edge trim, scratch rejection |
| Lamination (PET+LDPE) | ≥ 98% | 97% | ≤ 95% | Set-up waste, splice losses |
| Printing (8-color rotogravure) | ≥ 96% | 94-95% | ≤ 92% | Make-ready, registration scrap |
| Pouching (form-fill-seal) | ≥ 95% | 93-94% | ≤ 91% | Seal rejection, weighing tolerance |
| End-to-end (5 stages combined) | ≥ 88% | 82-85% | ≤ 78% | Compound effect of all above |
The end-to-end row is the punchline of this whole blog. Even a "good" flex-pack plant loses 12% of every kilogram of substrate between metalliser and finished pouch. An "average" plant loses 15-18%. A "poor" plant loses more than 22%. The cumulative cost of yield loss across the supply chain is bigger than most plants realise — typically 8-15% of total conversion cost — because each percentage point compounds across five stages.
🔄 Bonus — Loss in Rupees, Not Just Percent
Yield as a percentage is half the picture. The other half is yield-loss-in-money. The conversion is straightforward but rarely done at the operator level:
Three worked examples, using a typical Indian metalliser:
| Scenario | Loss kg | Substrate cost | Conversion cost | Loss ₹ per cycle |
|---|---|---|---|---|
| Good cycle (98% yield, 100 kg loss) | 100 kg | ₹140/kg PET | ₹50/kg metalliser | ₹19,000 |
| Average cycle (96% yield, 200 kg loss) | 200 kg | ₹140/kg PET | ₹50/kg metalliser | ₹38,000 |
| Poor cycle (94% yield, 300 kg loss) | 300 kg | ₹140/kg PET | ₹50/kg metalliser | ₹57,000 |
The ₹38,000 difference between a "good" cycle and a "poor" cycle is per single 5,000 kg cycle. Most metallisers run 25-30 cycles per month. The annual difference between a 98%-yield operator and a 94%-yield operator on a single machine is ₹38,000 × 30 cycles × 12 months = ₹1.4 crore. Operator-skill matters in flex-pack at a level few plant managers fully internalise.
⚠️ Three Common Mistakes
1. Averaging stage yields instead of multiplying. If a five-stage process has yields of 95%, 96%, 97%, 95%, and 96%, the end-to-end is NOT the average (95.8%) but the product (0.95 × 0.96 × 0.97 × 0.95 × 0.96 = 80.5%). The compound multiplier is brutal — even small per-stage drops cascade. Plant managers who report "average yield" are reporting a number that is structurally optimistic.
2. Comparing yield numbers across plants without standardising the definition. One plant counts setup waste as input loss; another counts it as separate downtime. Their yield numbers will differ by 2-4 percentage points for identical actual performance. Always anchor benchmarking to a clearly-stated definition. Within-plant trends are reliable; across-plant comparisons need a standardised methodology.
3. Mixing units between input and output. Input in kilograms, output in metres — meaningless number. The formula requires input and output in the SAME unit. The most common offender: input weight in kg but output count in rolls. Convert one to the other (using roll weight, blog #27) before applying the yield formula.
📚 Related reads on this site: This blog explains the Production Yield % calculator. Blog #24 covers the case study of cutting metallised waste from 1.8% to 0.9% (a yield improvement story). Blog #26 covers the same for bare film waste. Blog #28 handles how yield losses flow into conversion cost. The full set of free calculators is at vkstech.com/#calculators.
Disagree with the benchmark numbers? Working in a process stage not in the table? Want to discuss how to set up yield tracking that survives operator pushback? Drop your question in the Q&A section at the bottom of this page — I respond personally to every thoughtful question.
📌 What's next. Blog 39 — Machine Utilisation % Calculator — covers the running-time-to-shift-time ratio, the metric that most operators confuse with OEE and that most plant managers track wrong. Same calculator-deep-dive format.
📊 Production Yield % Calculator — वो Deceptively Simple Formula जो आपके 18% Output को छिपाता है
📖 9-min read | एक Number जो बताता है क्या आया vs क्या गया | May 2026 में published
5,000 kg metalliser jumbo slitter में जाता है। Slitter 4,830 kg customer-ready rolls देता है। Yield 96.6% है। आसान। पर उसी jumbo की journey continue होती है — 4,830 kg lamination में जाते हैं (output 4,720 kg, yield 97.7%), फिर printing (output 4,490 kg, yield 95.1%), फिर pouching (output 4,150 kg, yield 92.4%)। End-to-end yield चारों stages का sum या average नहीं है — product है: 96.6% × 97.7% × 95.1% × 92.4% = 83.0%। Customer 5,000 kg jumbo input के पैसे देता है पर 4,150 kg finished pouches receive करता है। हर खरीदे गए kilogram का 17% कहीं chain में scrap, edge trim, या process waste बनता है। ये blog उस formula को explain करता है जो vkstech.com पर free Production Yield % calculator के पीछे है — क्या compute करता है, सात real situations जहाँ operators और supervisors use करते हैं, और क्यों flex-pack production का सबसे simple formula सबसे ज़्यादा misapplied भी है।
📐 "Just Output को Input से Divide करो" इतना मुश्किल क्यों है
Formula के तीन pieces हैं, हर एक में definitional choice है जो answer change करती है। Input: machine पर loaded gross weight count करते हैं, या first-roll setup waste के बाद? Output: "good" का मतलब customer को shipped, या QC accepted, या बस produced (regardless कि बाद में reject हुआ)? Boundary: process कहाँ start और end होता है? "Metalliser yield" का मतलब सिर्फ़ metalliser cycle हो सकता है, या metalliser-plus-pre-slit waste, या metalliser cycle plus slitting में पकड़े गए सब tail-end downgrades।
इनमें से कोई choice ग़लत नहीं है। पर दो plants जो yield numbers compare कर रहे हैं उन्हें same definitions use करनी होंगी, वरना comparison meaningless है। ज़्यादातर plants एक definition pick करके trend analysis के लिए उसी पर stick रहते हैं — single plant के अंदर improvement over time absolute comparison across plants से ज़्यादा valuable है। नीचे का calculator simplest definition assume करता है: input वो है जो process में enter होता है, output वो है जो process से acceptable exit होता है, दोनों same unit में (typically kg)।
Unit जो आप pick करते हैं भी matter करती है। kg में yield mass-conversion efficiency बताता है। metres में yield length-conversion efficiency बताता है (kg से अलग अगर input और output के बीच micron-thickness changes हैं)। rolls में yield count-conversion efficiency बताता है (slitting के लिए useful अगर input rolls multiple output rolls में split होते हैं)। ज़्यादातर plants kg पर standardise करते हैं क्योंकि production planning, costing, और inventory सब उसी पर चलते हैं।
🛠️ सात Real Situations जहाँ Operators इसे Use करते हैं
1. Daily shift performance। Simplest use। हर shift के end पर, operator input weight (या length), output weight report करता है, और formula yield देता है। Weeks पर trended, ये किसी भी flex-pack production review में सबसे ज़्यादा watched number है।
2. Boat-set life optimization। Metalliser cycle के अंदर, yield start पर highest होता है (fresh boats, stable conditions) और end की तरफ़ degrade होता है (boat consumption, vapor instability)। Hour-of-cycle से yield track करना बताता है कब next boat change schedule करें। Yield curve cost-of-stretching-cycle data है।
3. Substrate trial evaluation। नई film trial हो रही है। Standard run yields 96%। Trial run yields 91%। 5-percentage-point gap वो है जो engineering team को या तो solve करना है (process tweaks) या costing में build करना है (नई substrate के दूसरे benefits के लिए acceptable trade-off)। Formula gap quantify करता है।
4. Operator-vs-operator comparison। Same machine, same shift duration, same product spec, तीन operators across तीन shifts। Yields 96.5%, 94.8%, 92.1%। 4.4-point spread operator-skill या operator-attention है, equipment नहीं। Number training gap identify करता है।
5. End-of-month financial close। Procurement ने 100 tonnes substrate buy किया। Production ने 92 tonnes finished output report किया। 8% gap inventory reconciliation में show होता है। अगर yield loss के रूप में accounted किया, cost of goods sold में जाता है। अगर unaccounted, inventory variance की तरह बैठता है और audit trigger करता है। Formula books cleanly close करता है।
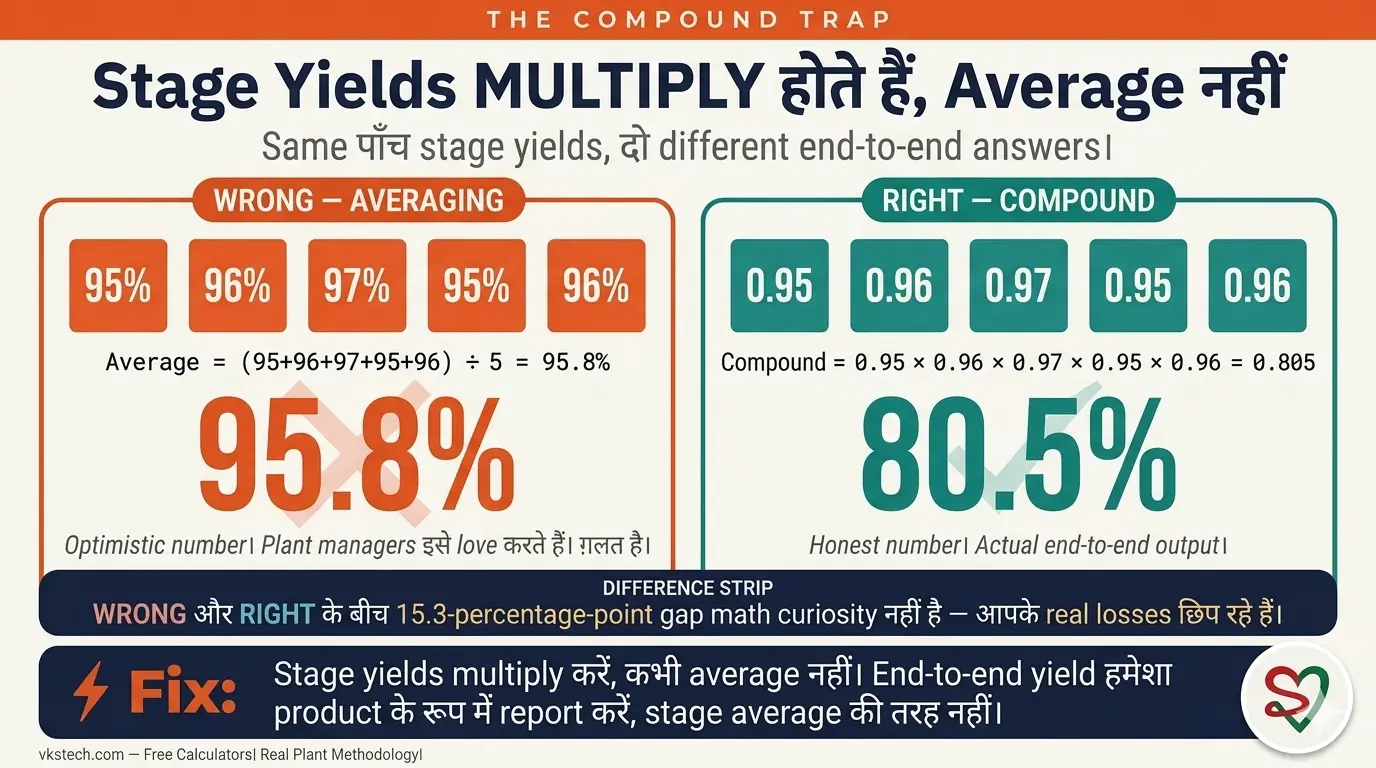
6. Compound yield analysis (multi-stage)। End-to-end yield के लिए, हर stage का yield together multiply करें। पाँच stages 95% each = 77.4%। पाँच stages 97% each = 85.9%। Even small per-stage improvements dramatically compound होते हैं। Formula identify करता है कहाँ compound multiplier सबसे ज़्यादा hurt करता है।
7. Sales-to-procurement reconciliation। Sales 5,000 kg customer order book करती है। Procurement 5,500 kg substrate buy करता है, ~9% yield loss expect करते हुए। अगर actual yield 95% है (loss 5%), production 4 percentage points से over-buy करती है और inventory bloat होती है। अगर actual yield 85% है (loss 15%), production under-buy करती है और order short ship होता है। Formula buffer set करता है।
🧮 Production Yield % Calculator (Embedded)
नीचे calculator आपके input और output values से yield, loss percentage, और absolute loss quantity calculate करता है। किसी भी consistent unit (kg, metres, sqm, rolls) में काम करता है। Shareable links और दूसरे related tools के लिए, vkstech.com पर full version use करें।
📊 Quick-Look Reference — Typical Yield Benchmarks
नीचे की table common flexible-packaging stages के लिए typical yield ranges दिखाती है। "Good" का मतलब India में plants का top quartile; "Average" median है; "Poor" bottom quartile। Benchmarking conversations के लिए bookmark करें।
| Process stage | Good (top 25%) | Average | Poor (bottom 25%) | Main loss source |
|---|---|---|---|---|
| Metalliser (PET 12μm) | ≥ 98% | 96-97% | ≤ 95% | Pinholes, source cleaning waste |
| Slitting (bare) | ≥ 98% | 96-97% | ≤ 94% | Edge trim, splice waste |
| Slitting (metallised) | ≥ 97% | 95-96% | ≤ 93% | Edge trim, scratch rejection |
| Lamination (PET+LDPE) | ≥ 98% | 97% | ≤ 95% | Set-up waste, splice losses |
| Printing (8-color rotogravure) | ≥ 96% | 94-95% | ≤ 92% | Make-ready, registration scrap |
| Pouching (form-fill-seal) | ≥ 95% | 93-94% | ≤ 91% | Seal rejection, weighing tolerance |
| End-to-end (5 stages combined) | ≥ 88% | 82-85% | ≤ 78% | Compound effect of all above |
End-to-end row इस पूरे blog का punchline है। Even एक "good" flex-pack plant metalliser और finished pouch के बीच हर kilogram substrate का 12% lose करता है। "Average" plant 15-18% lose करता है। "Poor" plant 22% से ज़्यादा। Supply chain across yield loss की cumulative cost ज़्यादातर plants जो realise करते हैं उससे बड़ी होती है — typically total conversion cost का 8-15% — क्योंकि हर percentage point पाँच stages पर compound होता है।
🔄 Bonus — Loss in Rupees, सिर्फ़ Percent में नहीं
Percentage के रूप में yield half picture है। दूसरा half yield-loss-in-money है। Conversion straightforward है पर operator level पर rarely किया जाता है:
तीन worked examples, typical Indian metalliser use करते हुए:
| Scenario | Loss kg | Substrate cost | Conversion cost | Loss ₹ per cycle |
|---|---|---|---|---|
| Good cycle (98% yield, 100 kg loss) | 100 kg | ₹140/kg PET | ₹50/kg metalliser | ₹19,000 |
| Average cycle (96% yield, 200 kg loss) | 200 kg | ₹140/kg PET | ₹50/kg metalliser | ₹38,000 |
| Poor cycle (94% yield, 300 kg loss) | 300 kg | ₹140/kg PET | ₹50/kg metalliser | ₹57,000 |
"Good" cycle और "poor" cycle के बीच ₹38,000 difference single 5,000 kg cycle के लिए है। ज़्यादातर metallisers 25-30 cycles per month run करते हैं। Single machine पर 98%-yield operator और 94%-yield operator के बीच annual difference है ₹38,000 × 30 cycles × 12 months = ₹1.4 crore। Operator-skill flex-pack में उस level पर matter करती है जो few plant managers fully internalise करते हैं।
⚠️ तीन Common Mistakes
1. Stage yields multiply करने के बजाय average करना। अगर पाँच-stage process के yields 95%, 96%, 97%, 95%, और 96% हैं, end-to-end average (95.8%) नहीं है पर product (0.95 × 0.96 × 0.97 × 0.95 × 0.96 = 80.5%) है। Compound multiplier brutal है — even small per-stage drops cascade करते हैं। Plant managers जो "average yield" report करते हैं structurally optimistic number report कर रहे हैं।
2. Definition standardise किए बिना plants across yield numbers compare करना। एक plant setup waste को input loss count करता है; दूसरा separate downtime count करता है। उनके yield numbers identical actual performance के लिए 2-4 percentage points से differ होंगे। Benchmarking को हमेशा clearly-stated definition पर anchor करें। Within-plant trends reliable हैं; across-plant comparisons को standardised methodology चाहिए।
3. Input और output के बीच units mix करना। Input kilograms में, output metres में — meaningless number। Formula को input और output SAME unit में चाहिए। सबसे common offender: input weight kg में पर output count rolls में। Yield formula apply करने से पहले एक को दूसरे में convert करें (roll weight, blog #27 use करके)।
📚 इस site पर related reads: ये blog Production Yield % calculator explain करता है। Blog #24 metallised waste 1.8% से 0.9% cut करने की case study cover करता है (एक yield improvement story)। Blog #26 bare film waste के लिए same cover करता है। Blog #28 handle करता है कैसे yield losses conversion cost में flow होते हैं। Free calculators का full set vkstech.com/#calculators पर है।
Benchmark numbers से disagree करते हैं? Table में नहीं किसी process stage में काम कर रहे हैं? Discuss करना चाहते हैं operator pushback survive करने वाली yield tracking कैसे setup करें? अपना सवाल इस page के bottom पर Q&A section में डालें — मैं हर thoughtful question का personally जवाब देता हूँ।
📌 आगे क्या। Blog 39 — Machine Utilisation % Calculator — running-time-to-shift-time ratio cover करता है, वो metric जिसे ज़्यादातर operators OEE से confuse करते हैं और ज़्यादातर plant managers ग़लत track करते हैं। Same calculator-deep-dive format।